The LMS reporting engine that turns data into decisions
Track, visualize, and share learning insights you need, when you need them.


See what’s happening across your learning platform
Track
Capture detailed training metrics across your organization, including learner progress and course completion rates.
Visualize
Turn raw data into clear visuals to spot trends and performance gaps quickly.
Share
Send custom reports to shareholders in just a few clicks to show your progress and keep them informed.
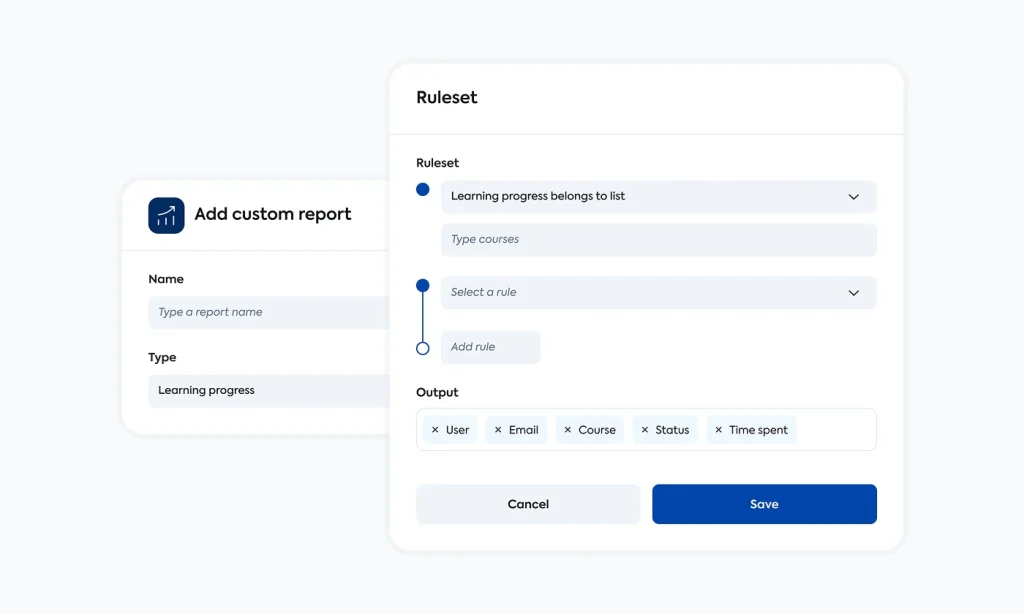
Custom LMS reports
With TalentLMS, you can control exactly what’s in your reports to match your organization’s needs. Customize the report type, create filtering rules by users, and save custom templates so you can pull the same insights whenever needed, in seconds.
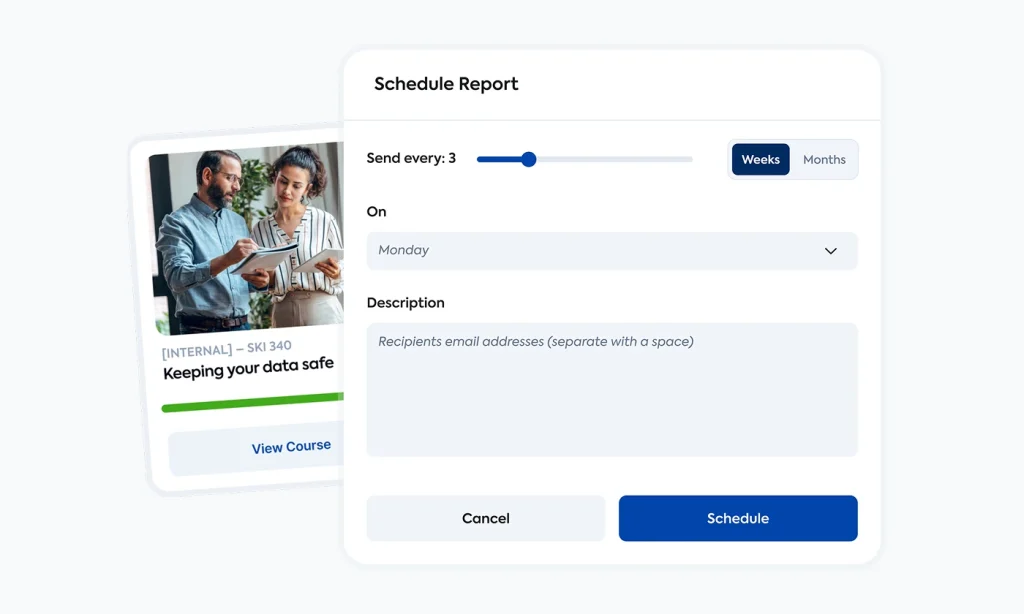
Scheduling reports
Never miss a reporting deadline again. Schedule your reports to arrive on a weekly or monthly basis to custom recipients, and you’ll never lose sight of your progress.
Share links to live reports so shareholders can view the most up-to-date information anytime.
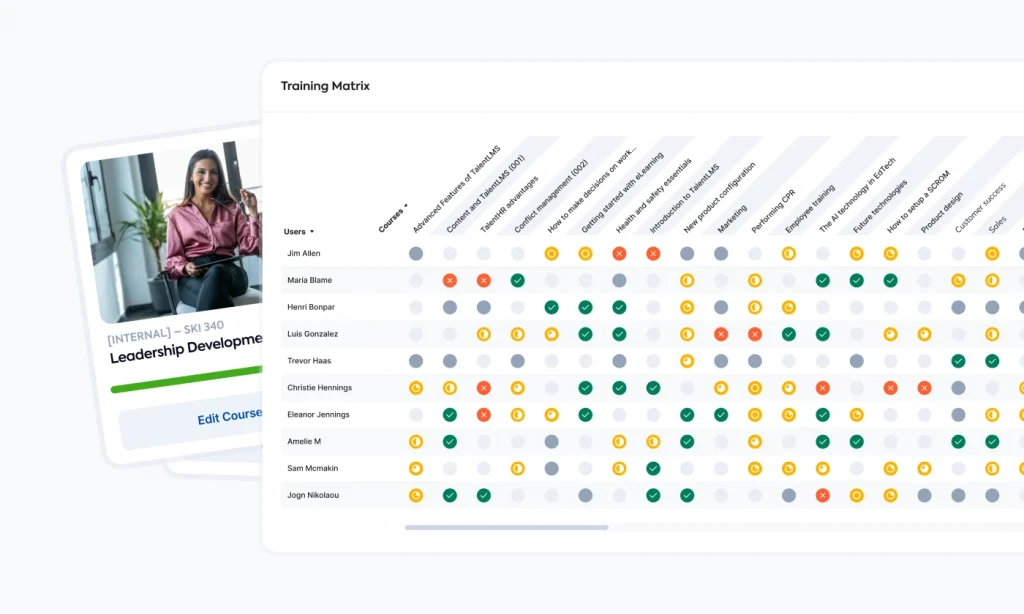
Training matrix
See the full picture of learner activity at a glance. The training matrix shows:
-
Which courses each user has started, progressed in, or completed
-
Who is falling behind on their training
-
Overall compliance across teams or departments
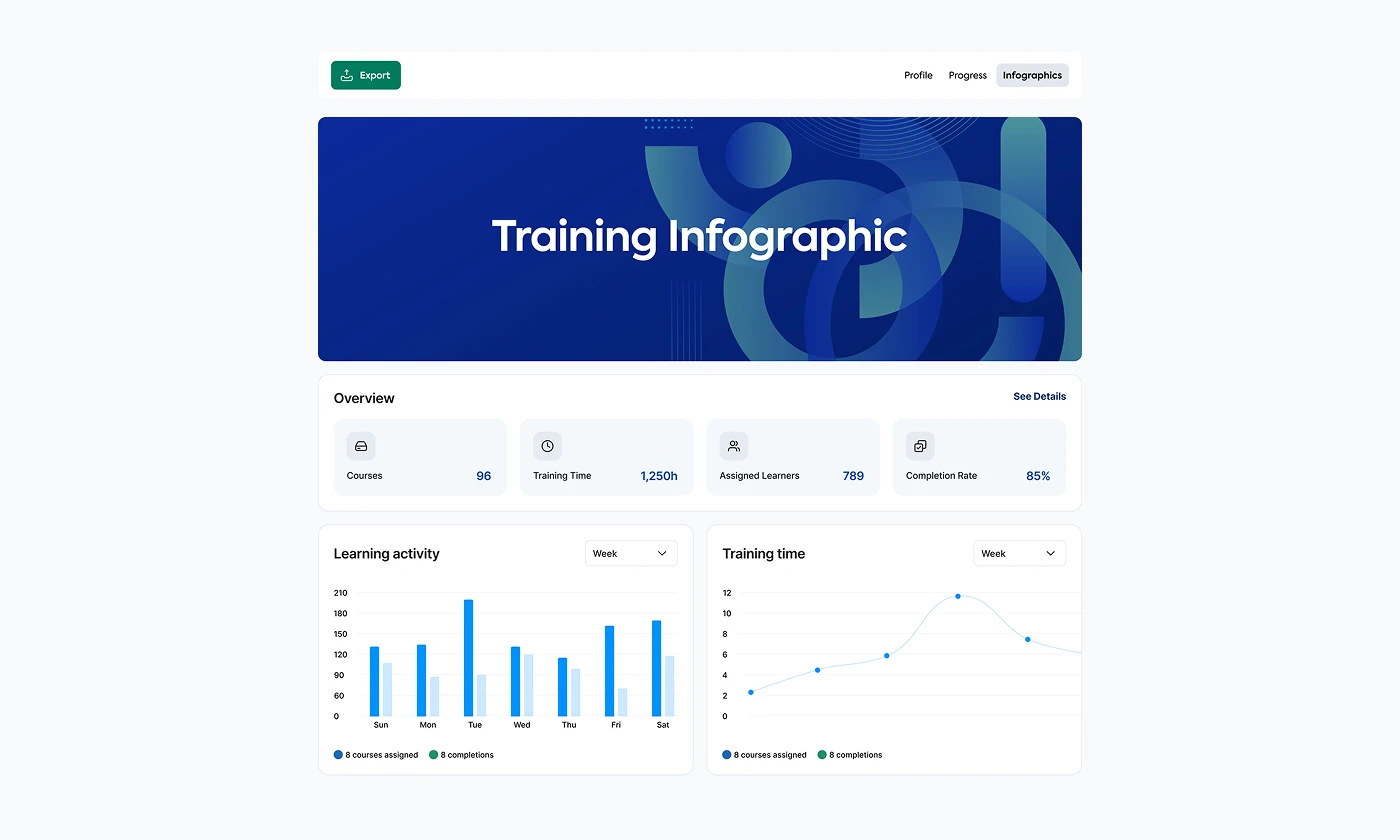
Analytics for your training progress
Turn your training data into clear, actionable insights.
Visualize learning progress, user activity, and course engagement with advanced, customizable dashboards. Celebrate milestones, track compliance, and monitor training trends at a glance.
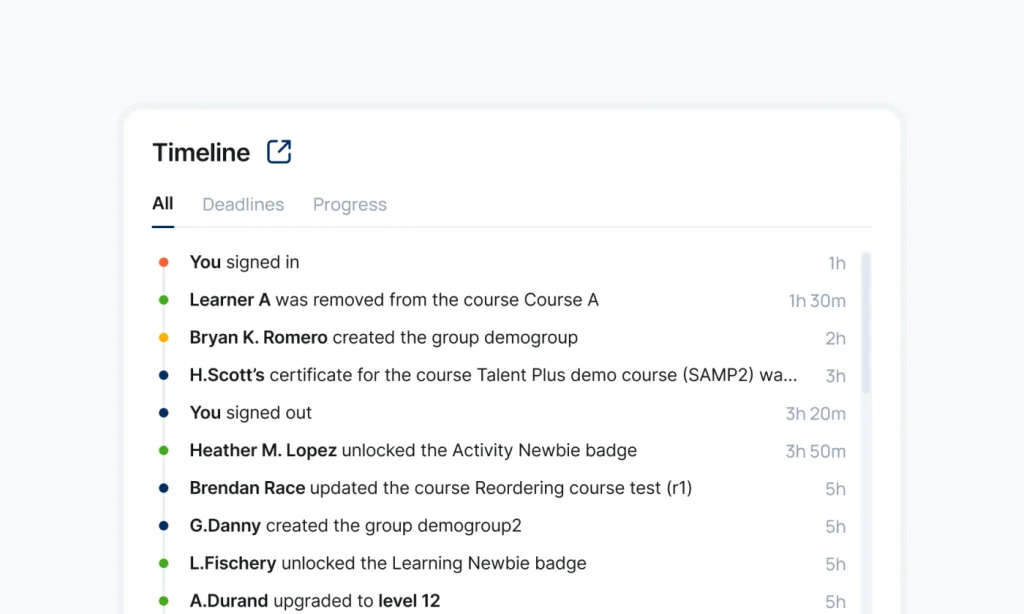
Timeline
Our LMS reporting engine also goes granular. Timeline captures every action every user takes on the platform, helping you spot weaknesses and find ways to improve productivity.
Detailed day-to-day records keep your organization prepared for audits based on compliance and regulatory training.
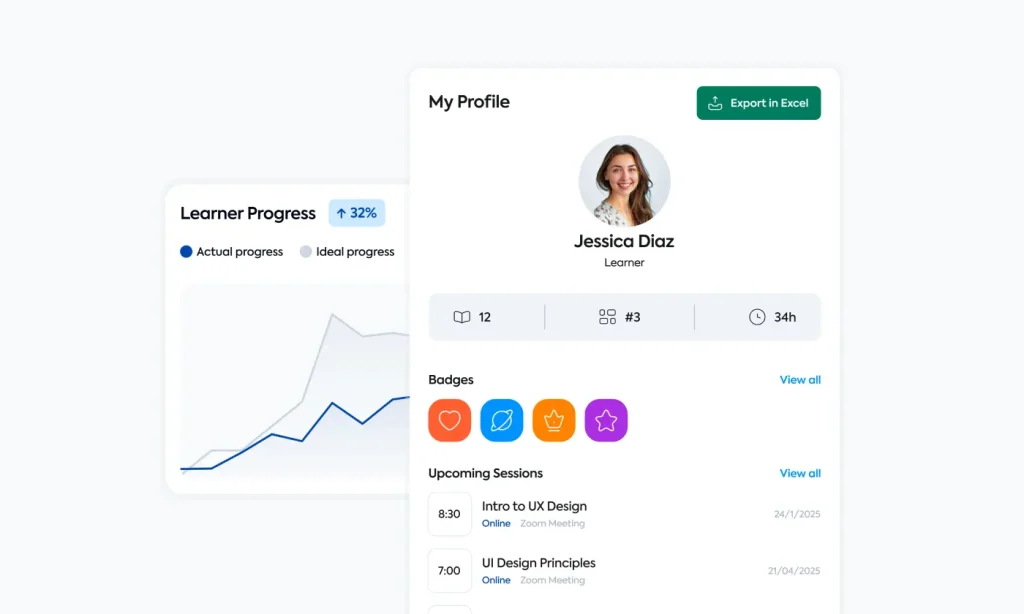
What your learners see
Learners can track their progress with easy-to-read dashboards showing completed courses, courses in progress, total training time, and more. This keeps them motivated and accountable, reducing admin follow-ups.
More key features that boost learner engagement and results
Assessment engine
Evaluate your learners’ progress with a variety of test types and extensive reporting on test results.
Multi-audience management
Create independent training hubs by team, department, branch, or location.
Certifications
Create accredited courses with the help of the AI course creator.
User types
Build user types to give custom permissions and access to view reports.
Better reporting drives better results
Start tracking, analyzing, and improving training outcomes today.