
- What are learning and development metrics?
- 14 key L&D metrics: From activity to impact
- Level 1: Foundational metrics (necessary—but not enough)
- Level 2: Learning effectiveness metrics (does learning stick?)
- Level 3: Business impact metrics (where learning delivers results)
- How to choose the right L&D metrics
- Why you should track employee training metrics
- How to measure training effectiveness
- The future of L&D: From checkbox training to measurable impact
- L&D metrics: FAQs
Are you measuring training activity or training impact?
Do your L&D metrics tell you what courses employees completed or what they actually learned and applied? Are you collecting data for reporting purposes or to drive real business results?
If your program metrics stop at completion rates and satisfaction scores, you may be checking boxes without proving performance.
Learning that doesn’t show up in performance isn’t development; it’s activity. And training that just checks the boxes isn’t harmless. In fast-moving organizations, it creates risk to people and businesses.
In this guide, we’ll break down 14 learning and development metrics that help you move beyond checkbox training and instead:
- measure training effectiveness
- track learning impact
- demonstrate employee training ROI
- position training as a performance driver.
What are learning and development metrics?
Learning and development metrics are quantifiable indicators that measure both the effectiveness and the business impact of employee training programs.
At surface level, they show what happened during training. At a strategic level, they reveal whether learning translated into improved performance, productivity, and measurable business results.
That distinction is critical.
Consider “hours trained.” As instructional design Dr Heidi Kirby noted in TalentTalks, the TalentLMS podcast, if you’re delivering workplace safety training, the metric that matters isn’t time spent in a course—it’s whether on-site accidents decrease. Focusing on hours alone measures exposure, not effectiveness.

The most valuable L&D metrics function less like a report card and more like a diagnostic tool. They surface knowledge gains, skill application, and behavioral change—the signals that learning is actually influencing performance. With that visibility, you can refine learning and development programs, allocate resources more effectively, and ensure every training investment contributes to real outcomes.
Without meaningful metrics, you’re operating on assumption.
14 key L&D metrics: From activity to impact
Not all program metrics carry equal weight. Some show participation. Others show capability. The most valuable ones show business impact.
To move from checkbox training to impact, you need visibility across all three levels.
Level 1: Foundational metrics (necessary—but not enough)
Let’s start with the beating heart of training—the learners themselves. Learner-centric L&D metrics focus on their experience and the immediate outcomes of training.
These metrics show whether training happened. They provide baseline visibility, but they don’t yet prove learning effectiveness or business value.
1. Completion rate
Completion rate is a fundamental measure of employee engagement. It tracks the percentage of learners who finish a training course or training and development program. While a high completion rate isn’t a guarantee of learning (many learners are guilty of clicking through without truly absorbing), a low completion rate is a definite red flag.
For example, if only half your team completes essential compliance training, it’s time to investigate. Is the material too dense? Is the platform hard to use? Are employees overloaded?
How to calculate completion rate:
Completion rate (%) = (total number of learners who completed the course ÷ total number of learners enrolled) x 100
Pro tip: Go beyond the overall number. Analyze completion rates by department, team, or job role. This can reveal specific areas where learners are struggling.
2. Active participation rate
This metric separates passive content consumption from active participation in the training process. It does this by looking beyond click rates or completion rates. Instead, you’ll look for learners sparking lively debates in online forums, voluntarily taking practice quizzes, or contributing thoughtful comments. These actions show a healthy, engaged learning community.
More importantly, active involvement is a strong indicator of knowledge absorption and future application.
How to calculate active participation rate:
Active participation rate (%) = (total enrolled participants ÷ number of actively engaged participants) x 100
Heads-up: Based on the extent of the course, it may not be possible to obtain every metric.
Active participation can be measured using:
3. Learner satisfaction (feedback scores/surveys)
Learner satisfaction (or training feedback) reflects how learners feel about the training they’ve received. Data for this metric is usually gathered directly through surveys, ratings, or open-ended questions. It’s your opportunity to receive unfiltered feedback on what resonated, what didn’t, and where improvements can be made.
For this type of metric, go beyond simple, “Did you enjoy this course?” questions. Ask targeted questions like, “How relevant was this training to your everyday tasks?” and “What’s one thing we could do to make this training even better?”
Combining these open-ended responses with rating scales (like 1-5 star ratings) provides both qualitative insights and quantifiable data.
![]()
How to calculate learner satisfaction:
Average satisfaction score = total sum of all the individual ratings or scores ÷ total number of respondents
Pro tip: Aim for a mix of question types to get a well-rounded understanding of learner sentiment—the best of both worlds.
4. Learner progress rate
Learner progress rate tracks how employees are moving through the material. Its value is in identifying roadblocks and then intervening where necessary to remove them.
For instance, if many learners are stalling on Module 3 of your new software training, that signals that something needs attention. The content may be confusing, the instructions unclear, or additional resources may be required.
How to calculate learner progress rate:
Learner progress rate (%) = (total enrolled learners ÷ number of learners who have met a defined milestone* or key module) x 100
(*such as 50%, 75%, 90%)
Pro tip: Use this insight to iterate and improve course content and delivery.
Level 2: Learning effectiveness metrics (does learning stick?)
This is where measuring training effectiveness truly begins.
These metrics assess whether learning is retained, applied, and integrated into real work.
5. Pre- and post-training assessments (test scores)
Pre- and post-training assessments provide a direct measure of knowledge gain. Observing and testing learners before and after training helps you quantify how much their understanding of the subject has improved.
For example, a group of new hires might score an average of 60% on a pre-training assessment about company policies. After completing the onboarding program, that average jumps to 90% on a post-training test. That’s a clear indication that learning took place.
How to calculate pre- and post-training assessments:
Knowledge gained (%) = (post-assessment score − pre-assessment score ÷ pre-assessment score) x 100
Heads-up: Check that your assessments are valid and reliable. They must accurately measure the specific knowledge and skills the training aims to teach, and the training survey questions should be consistent.
Pro tip: Need a helping hand? See our guide to the right training survey questions to ask.
6. Knowledge retention rate (follow-up assessments)
This L&D metric measures how much knowledge learners retain over time, typically weeks or months after initial training.
It’s the key to ensuring that training translates into lasting change, not just a temporary bump in scores.
How to calculate knowledge retention rate:
Knowledge retention rate (%) = (post-assessment score 3 months after training ÷ post-assessment score directly after training) x 100
Pro tip: Use spaced repetition (short quizzes, review sessions, or even just well-timed email reminders) to reinforce learning and boost long-term retention.

7. On-the-job application (observed behaviors/performance data)
On-the-job application checks whether learners are using their new skills and knowledge in their day-to-day work. It’s about real-world impact—arguably the most valuable metric of all.
For this one, you’re seeking tangible evidence of changed behavior and improved performance on the front lines.
For example, after that sales training, are reps actually using those new closing techniques with clients? Or did that leadership course translate into managers providing better feedback?
How to calculate on-the-job application:
On-the-job application rate (%) = (total employees who completed training ÷ number of employees applying skills on the job) × 100
Heads-up: This metric requires a bit more effort to track. You should observe employees directly, review performance data, and gather feedback from supervisors.
8. Training time to proficiency
This metric is all about speed, but not just any speed. It measures how long it takes for learners to become competent in the new skills or knowledge after completing the training.
The shorter the time to proficiency, the faster your employees can put their learning into action. And the quicker you’ll see results.
You don’t, for example, want your new sales reps stuck in training limbo for months. You want them hitting the phones and closing deals ASAP.
How to calculate training time to proficiency:
Training time to proficiency = Total training hours per employee ÷ time taken to reach proficiency*
Proficiency can be determined by:
Pro tip: Don’t just track the average time to proficiency. Look for outliers—are some learners taking significantly longer to get up to speed? This could point to individual learning needs or gaps in the training itself.
Level 3: Business impact metrics (where learning delivers results)
This is where training becomes a performance driver.
If you’re not measuring here, you’re still in checkbox territory.
9. Performance improvement
Employee performance metrics track if the training is making a difference to key performance indicators (KPIs). It’s about directly linking L&D efforts to measurable improvements that matter to the organization.
For instance, did that conflict resolution training for your customer service team lead to a noticeable drop in complaints? Or an uptick in positive customer satisfaction scores? That’s the kind of tangible employee performance improvement businesses are after.

How to calculate performance improvement:
Performance improvement (%) = (post-training KPI − pre-training KPI) ÷ pre-training KPI) X 100
Pro tip: Be clear about which KPIs you’re tracking before you roll out the training. This will make measuring the impact far more accurate—and far less of a headache.
10. Productivity gains
Productivity gains measure whether your training programs are making people more efficient—a key ingredient for a thriving business.
For example, signs of higher productivity after training could include employees doing tasks faster, with fewer mistakes, or handling more work with the same accuracy.
How to calculate productivity gains:
Productivity gain (%) = (post-training productivity − pre-training productivity ÷ pre-training productivity) × 100
Pro tip: Don’t just rely on subjective impressions. Look for concrete data. This will vary according to job role.
Productivity can be measured using:
11. Training return on investment (ROI)
Out of all the business impact metrics, this is the big one. ROI shows, in dollars and cents, whether your training investment is paying off.
ROI compares the financial benefits of training (for example, increased revenue, cost savings) to the total costs (development, delivery, learner time).
For example, let’s say you invested $10,000 in a sales training program, and as a direct result, your team generated $30,000 in additional revenue. That’s a hefty ROI—and the kind of number that makes everyone, from the CEO to the newest trainee, take notice.
How to calculate training return on investment:
ROI (%) = (benefit − total cost ÷ total cost) X 100
Caution: Calculating ROI for training can get tricky. Be realistic in your projections, account for all relevant costs and benefits, and remember that not every positive outcome can be easily quantified. The value of training is more than just numbers.
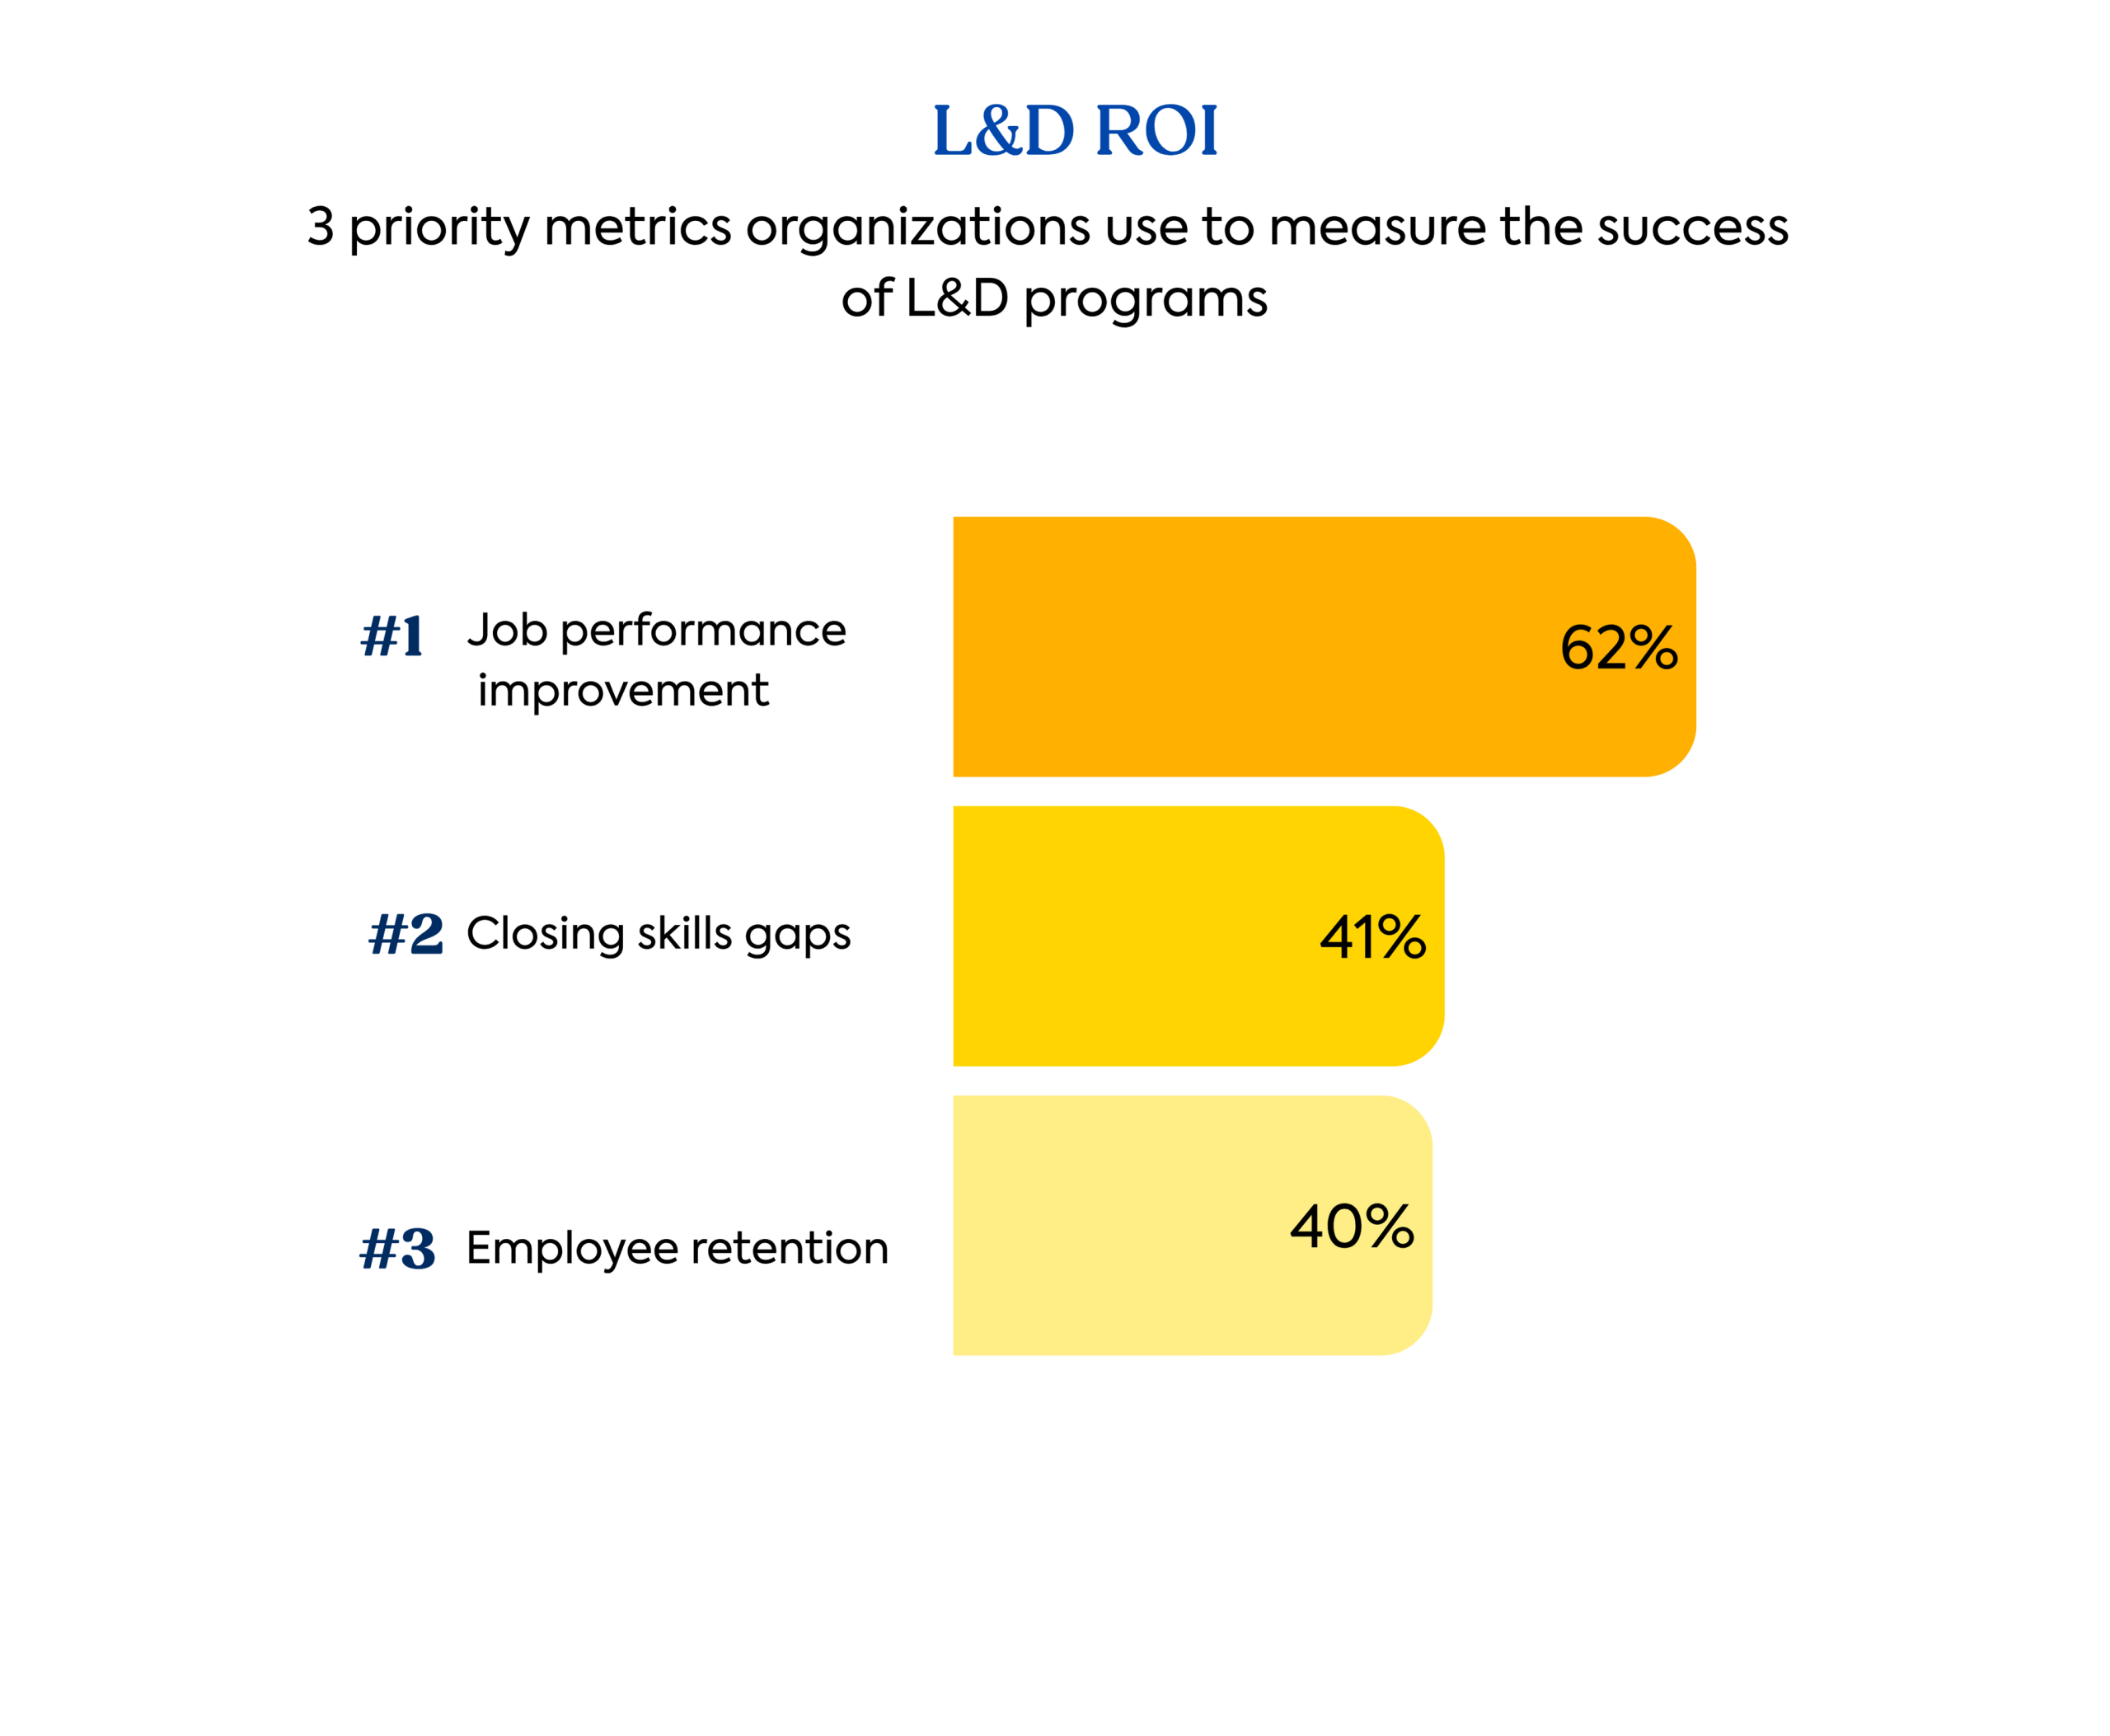
12. Employee retention impact
This metric looks at the percentage of employees who remain with the company over a specific period and how this links to training received. It can be a surprisingly good indicator of your L&D program’s overall health.
High retention often means you’re not just teaching skills but also fostering a culture of growth and professional development—and that’s worth its weight in gold.
For instance, if your employee retention rate is noticeably higher than the industry average, it’s a strong sign that your training initiatives contribute to a positive, engaging work environment. Data from LinkedIn backs this up. According to their research, 94% of employees would stay with their company longer if there was an investment in learning.
In turn, that means less time and money spent on recruiting and onboarding replacements.
How to calculate employee retention impact:
Retention rate increase (%) = (retention rate of trained employees* − retention rate of untrained employees** ÷ retention rate of untrained employees) x 100
* Retention rate of trained employees (%) = (number of trained employees still employed after a set period ÷ total trained employees at the start) × 100
** Retention rate of untrained employees (%) = (number of untrained employees still employed after a set period ÷ total untrained employees at the start) × 100
Pro tip: Don’t look at retention in isolation. Pair it with employee satisfaction surveys and exit interviews to clearly understand why people are staying (or leaving).
13. Training cost per learner
Training cost per learner breaks down the total cost of your training program and divides it by the number of participants. It’s a simple yet essential metric for tracking expenses and spotting potential areas for savings.
For example, if your cost per learner is way higher than what other companies are spending, it might be time to look at cheaper options. Maybe that means using more online modules instead of flying everyone out for workshops or finding ways to create content more efficiently.
How to calculate training cost per learner:
Training cost per learner = total costs ÷ the total number of learners.
Pro tip: Don’t just look at the overall cost. Break down expenses into categories (for example, training materials, instructor fees, and technology) to pinpoint exactly where your money is going.
14. Training development efficiency / ratio
The training development ratio tells you how efficiently you’re creating training content. Specifically, it looks at the time it takes to develop your learning materials relative to the total length of the training itself.
For instance, if it’s taking your team an incredibly long time to build a relatively short online course, it might be a sign to do some serious training evaluation. Maybe you need to invest in better authoring tools. Or perhaps your team could benefit from some upskilling in instructional design.
How to calculate training development efficiency / ratio:
Training development ratio = the number of hours it takes to create the learning material / the total hours of training produced.
Pro tip: It’s not just about speed—it’s about quality, too. A rushed development process can lead to subpar training, so find the right balance.
How to choose the right L&D metrics
Not every metric matters equally for every organization.
To identify the appropriate data set for you, ask the following questions:
- What business outcome are we trying to influence?
- What performance gap are we solving?
- How will we know learning worked?
Start with business objectives. Then align these with learning metrics. That way you shift from measuring training activity to measuring learning impact.
Why you should track employee training metrics
The workforce is changing. AI is accelerating skill disruption. Organizations are moving toward skills-based talent strategies. Performance expectations are rising.
Against this backdrop, training that doesn’t improve performance isn’t harmless—it’s a risk.
Because, without measurable impact, skill gaps widen, productivity stalls, compliance exposure increases, and high performers disengage. Organizations that win treat learning as a strategic performance lever—not a checkbox exercise. And by doing so, are able to:
Show training ROI and secure funding
TalentLMS research shows that less than half of executives link increased profitability and growth rates with a growth mindset.
If you want to get your budget requests rubber-stamped instead of scrutinized, you need to speak the language of the C-suite. Simply put, you need to talk results.
Tracking L&D metrics lets you ditch the vague claims and show, with hard data, how your training programs are directly impacting the bottom line. It’s about proving you’re not just spending money but investing it wisely.
Optimize training programs for maximum impact
Tracking L&D metrics is the first step to improving your training programs. Data serves as a diagnostic tool, revealing what works well and what doesn’t.
For example, low completion rates on a specific module signal a need to revamp the content or delivery. Poor knowledge retention scores show it’s time to add some spaced repetition or more engaging activities.
Personalize the learning experience
One-size-fits-all training is a relic of the past. Tracking L&D metrics helps you tailor learning paths and provide targeted support, creating a far more effective and engaging experience for each employee.
A personalized learning experience is also one of the top 3 motivators for learning, according to LinkedIn’s Workplace Learning Report.
L&D metrics can highlight individual learning gaps or areas where someone excels. This means you can offer extra resources to those struggling while providing more advanced challenges to those ready to move ahead.
Align training with business goals
Tracking the right metrics ensures your L&D efforts are directly helping to achieve business objectives. Think of it as making sure everyone’s rowing in the same direction.
This is about connecting the dots. If your company’s aiming to boost customer satisfaction, your employee training metrics program should track how well you are equipping employees to deliver top-notch service. It’s about demonstrating that L&D is a vital part of the company’s success and having the data to prove it.
Make informed decisions
Organizations that make data-driven decisions are, on average, 5% more productive and 6% more profitable than their competitors. Tracking L&D metrics enables you to make data-driven decisions about every aspect of your training programs.
Instead of guessing which training delivery method is most effective, you can look at the data. Maybe your L&D metrics reveal that online modules have higher completion rates and better knowledge retention than in-person workshops, or vice versa. That’s the power of informed decision-making.
Be transparent about training
The modern workforce isn’t content to be passive recipients of training. Employees now want transparency, control, and a clear understanding of their development journey.
This isn’t just a trend—it’s a massive shift in employee expectations. According to TalentLMS research, 68% of employees want access to more data about their training to measure and analyze their progress.
With clear L&D metrics in hand, you can give each employee an insight into their own L&D journey, which can help to motivate and direct their efforts.
How to measure training effectiveness
Manual tracking and spreadsheets can’t support performance-based learning at scale. If you’re serious about moving beyond checkbox training, measurement needs to be continuous, connected, and actionable.
A modern AI LMS makes that possible.
Instead of collecting isolated data points, an AI learning management system centralizes and automates tracking across your key learning and development metrics—from completion and knowledge retention to on-the-job application and training ROI.
Real-time dashboards provide instant visibility into learner progress, engagement levels, and learning effectiveness.

But visibility alone isn’t enough.
The real shift happens when learning data connects to business data.
Advanced AI LMS platforms integrate with HRIS and performance management systems to correlate training with business KPIs. That means you can track:
- Skill gap trends across teams
- Time to proficiency for new hires
- Performance improvements post-training
- Productivity shifts tied to specific learning initiatives
- Retention patterns linked to development opportunities
With AI-driven skill gap detection and predictive insights, you can measure training effectiveness and identify where performance risk is emerging before it impacts results. Learning can then be delivered in the flow of work, targeted to the right people at the right time.
Personalization is where measurable impact accelerates. By analyzing learner behavior and performance signals, AI can adapt content, recommend reinforcement, and provide additional support where needed. The result is stronger knowledge retention, faster skill development, and learning that shows up in performance.
When training data connects directly to performance outcomes and operational efficiency, learning becomes measurable and defensible.
And that’s when L&D moves from reporting activity to driving business impact.
The future of L&D: From checkbox training to measurable impact
For years, L&D struggled to prove its value.
Now, that’s no longer optional.
In a performance-driven, skills-based economy, learning must show:
- Learning effectiveness
- Real performance improvement
- Clear business outcomes
- Measurable ROI
Moving beyond checkbox training isn’t a trend. It’s a strategic shift.
The organizations that lead won’t be the ones that train the most. They’ll be the ones that prove their learning works.
L&D metrics: FAQs
You measure employee training by using L&D metrics. These provide quantifiable data on various aspects of training, such as learner engagement, knowledge acquisition, on-the-job application, and overall business impact. Combined, these help to tell you if the training is effective or not.
While many KPIs are relevant, transfer of learning is a major one. It measures whether employees can apply what they’ve learned to their actual jobs. This is the ultimate goal, therefore it’s a good option.
An LMS is the most efficient way to track training progress. It automatically records completion rates, assessment scores, and engagement metrics. For qualitative data, gather feedback through surveys and observe on-the-job performance. Regular check-ins are also useful to track progress.
Training data comes from several sources. An LMS is the primary source for quantitative data on completion, engagement, and assessments. Surveys and feedback forms provide qualitative data on learner satisfaction and perceived relevance. Also, look at performance management systems for data and business intelligence (BI) tools. Direct observation is also a useful way to gather data.
How do you measure employee training?
What is one KPI for training?
How do you track employee training progress?
Where do you get training data from?
Originally published on: 04 Mar 2025 | Tags: L&D metrics,Training metrics